Home > By-census Results > Snapshot of Hong Kong Population > Characteristics of Persons Living in Subdivided Units
Characteristics of Persons Living in Subdivided Units
There were some 92 700 subdivided units (SDUs) in Hong Kong, accommodating some
209 700 persons
1. According to the results of the 2016 Population By-census, there were some 27 100 quarters with SDUs in Hong Kong. The total number of SDUs in these quarters was estimated to be some 92 700. In other words, each of these quarters was subdivided into 3.4 SDUs on average. These SDUs accommodated some 91 800 households and 209 700 persons. The average household size was 2.3 persons.
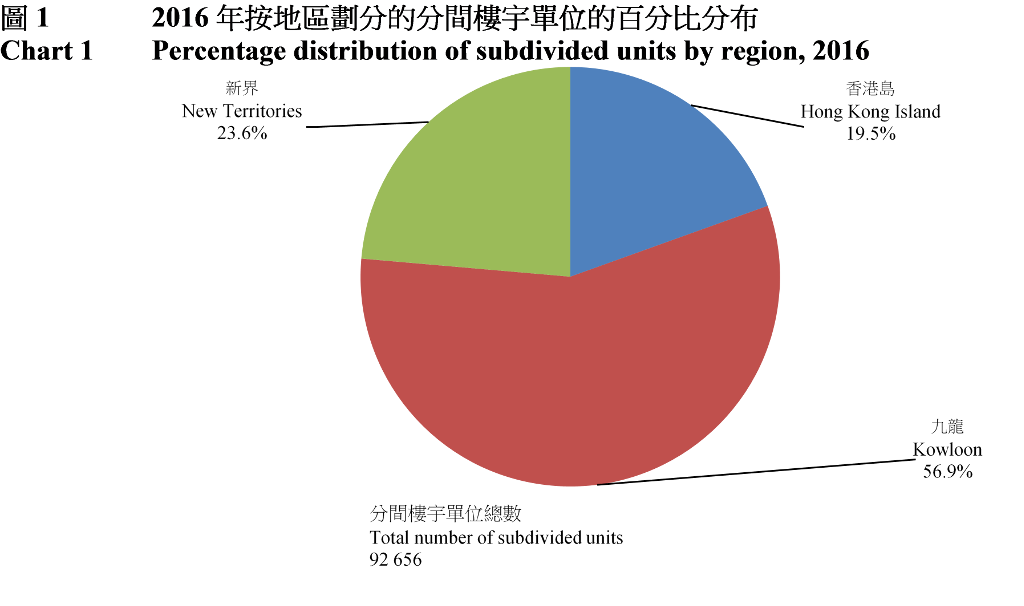
About 60% SDUs were located in Kowloon, concentrating in the Yau Tsim Mong district and the Sham Shui Po district
2. Analysed by region, in 2016, some 52 700 (56.9%) SDUs were located in Kowloon, 21 900 (23.6%) in the New Territories and 18 100 (19.5%) on Hong Kong Island. District Council districts with a larger number of SDUs included the Yau Tsim Mong (21 500), Sham Shui Po (15 400), Kowloon City (9 000), Eastern (8 400) and Tsuen Wan (6 600) districts.
(Chart 1 and Table 1)

Among persons living in SDUs, there were more children and young to middle-aged persons
3. Analysed by age group, 28.4% of the 207 200 persons (excluding foreign domestic helpers) living in SDUs in 2016 were aged below 25, 39.4% aged 25 - 44, 24.0% aged 45 - 64, while those aged 65 and over accounted for 8.2%. Compared with the whole population, the proportions of children (i.e. those aged below 15) and young to middle-aged persons (i.e. those aged 25 - 44) living in SDUs were notably higher, and the opposite was observed for persons aged 45 and above.
(Table 2)

About 10% of non-Chinese were living in SDUs, higher than the corresponding proportion of the whole population (3%)
4. Analysed by ethnicity, 87.1% of those persons (excluding foreign domestic helpers) living in SDUs in 2016 were Chinese, followed by South Asians# (6.5%) and Filipinos (2.1%). As for the whole population, the corresponding figures were 96.2%, 1.1% and 0.3% respectively.
(Table 3)
5. 10.2% of non-Chinese were living in SDUs, higher than the corresponding proportion of the whole population (3.0%).
(Table 3)

The median floor area of accommodation of households living in SDUs was 10.0 square metres, and the median monthly rental payment was $4,500
6. The median floor area of accommodation of households living in SDUs was 10.0 square metres (or 107.6 square feet) in 2016. The median per capita floor area of accommodation was 5.3 square metres (or 56.5 square feet), lower than that of all domestic households at 15.0 square metres (or 161.5 square feet).
(Table 4)
7. Excluding rent-free households, the median monthly rental payment of households living in SDUs was $4,500.
(Table 5)

The median monthly household income of households living in SDUs was $13,500
8. In 2016, the median monthly household income of households living in SDUs was $13,500, far lower than that of all domestic households ($25,000). Excluding rent-free households and households without income, the median rent to income ratio for households living in SDUs was 31.8%, similar to that of all households living in private residential flats, at 30.7%.
(Table 5)

Note:
# According to the classification of territories prepared by the Statistics Division of the United Nations Secretariat, South Asian economies include India, Pakistan, Nepal, Bangladesh, Sri Lanka, Afghanistan, Bhutan, Iran and Maldives. Owing to limitations of data, figures related to "South Asians" in this report only include the first five ethnic groups. "Other South Asian" include "Bangladeshi" and "Sri-Lankan".
Other references
1. 2016 Population By-census - Main Results
2. 2016 Population By-census - Summary Results
3. 2016 Population By-census – Thematic Report: Persons Living in Subdivided Units

