Home > By-census Results > Snapshot of Hong Kong Population > Internal Migration and Home Moving Characteristics of Hong Kong Population
Internal Migration and Home Moving Characteristics of Hong Kong Population
On average around one in five persons had changed their residence in the past 5 years
1. In 2016, 1.31 million persons aged 5 and over had changed their residence in the past 5 years, accounting for 18.6% of Hong Kong population aged 5 and over. Persons who had changed their residence included 0.75 million who had internally migrated and 0.56 million who had moved their home within the same district.
2. Persons who had internally migrated refer to those who had moved either (i) from a District Council district to another District Council district; or (ii) within a District Council district in the New Territories, from a new town to another new town (for example from the Sha Tin new town to the Ma On Shan new town), or from a new town to other areas in the district (for example from the Tai Po new town to other areas in Tai Po) or vice versa.
(Table 1)

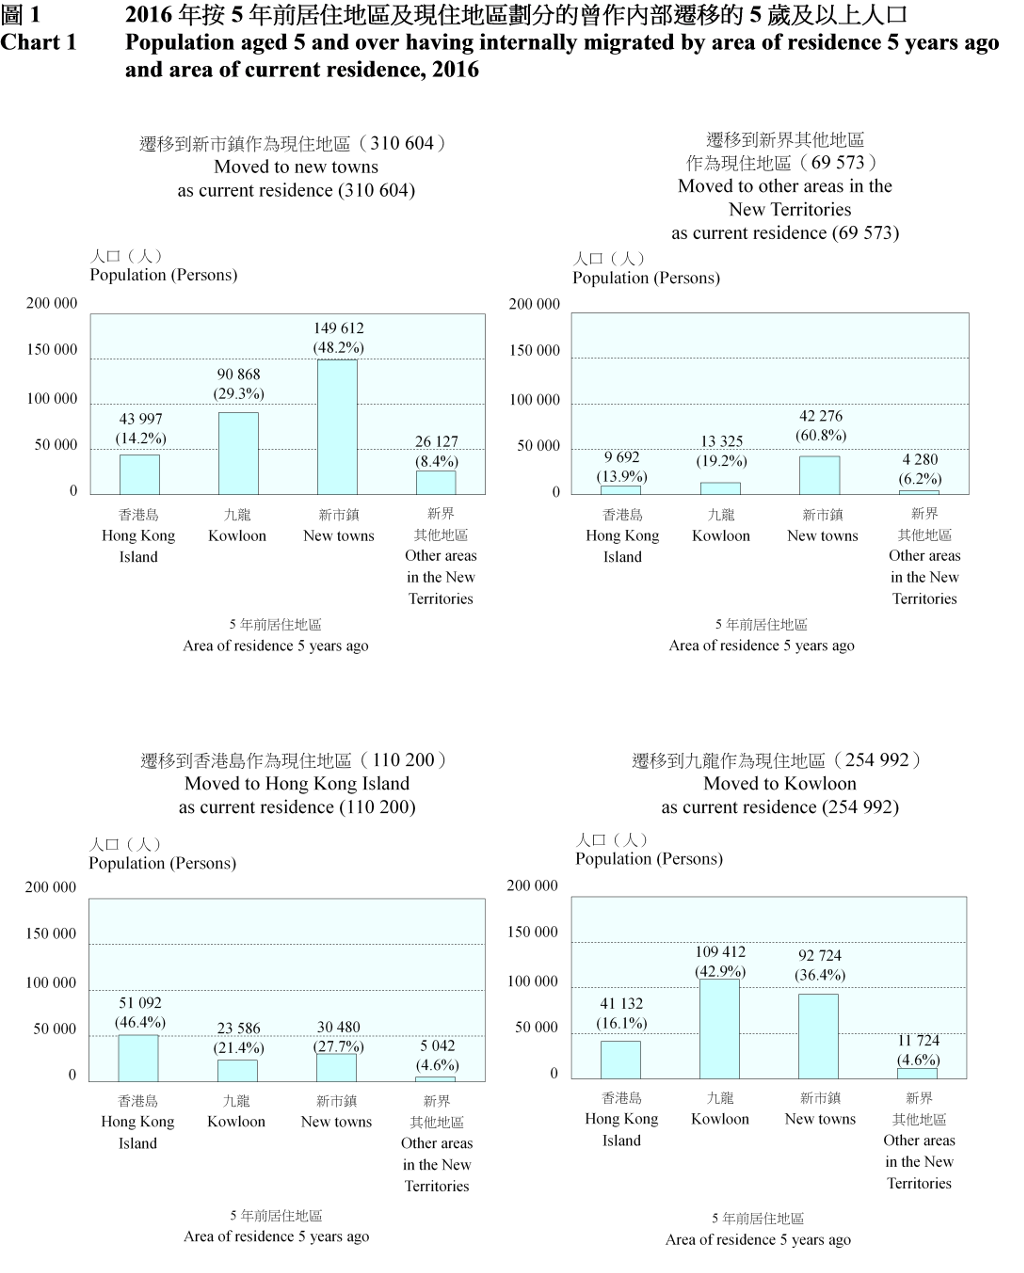
40% of the population who had internally migrated moved to new towns
3. Of the 0.75 million persons who had internally migrated between 2011 and 2016, around 40% (0.31 million persons) moved to new towns. Around half of them (0.15 million persons) were from other new towns and another 30% (0.09 million persons) were from Kowloon.
4. Besides, 0.25 million persons moved to Kowloon, of whom over 40% (0.11 million persons) were from other areas in Kowloon and less than 40% (92 724 persons) were from the new towns.
(Chart 1)
Persons aged 25-44 were more likely to migrate internally
5. The age structure of persons who had internally migrated suggested that persons aged 25-44 were more likely to migrate internally. This may be related to their higher probability of marriage, child birth and forming their own families.
6. Among persons who had internally migrated, 22.3% were aged 25-34 and 23.7% were aged 35-44. The corresponding figures for those not having internally migrated were 14.6% and 15.3% respectively. On the other hand, persons aged 5-24 and those aged 45 and over were less prone to internal migration.
Persons who had internally migrated generally had higher educational attainment
7. Persons who had internally migrated in general had higher educational attainment than those not. The relative differential is the greatest at the highest level where degrees in post-secondary education were attained by 28.2% of persons who had internally migrated as compared with only 19.6% of those not.
(Table 2)

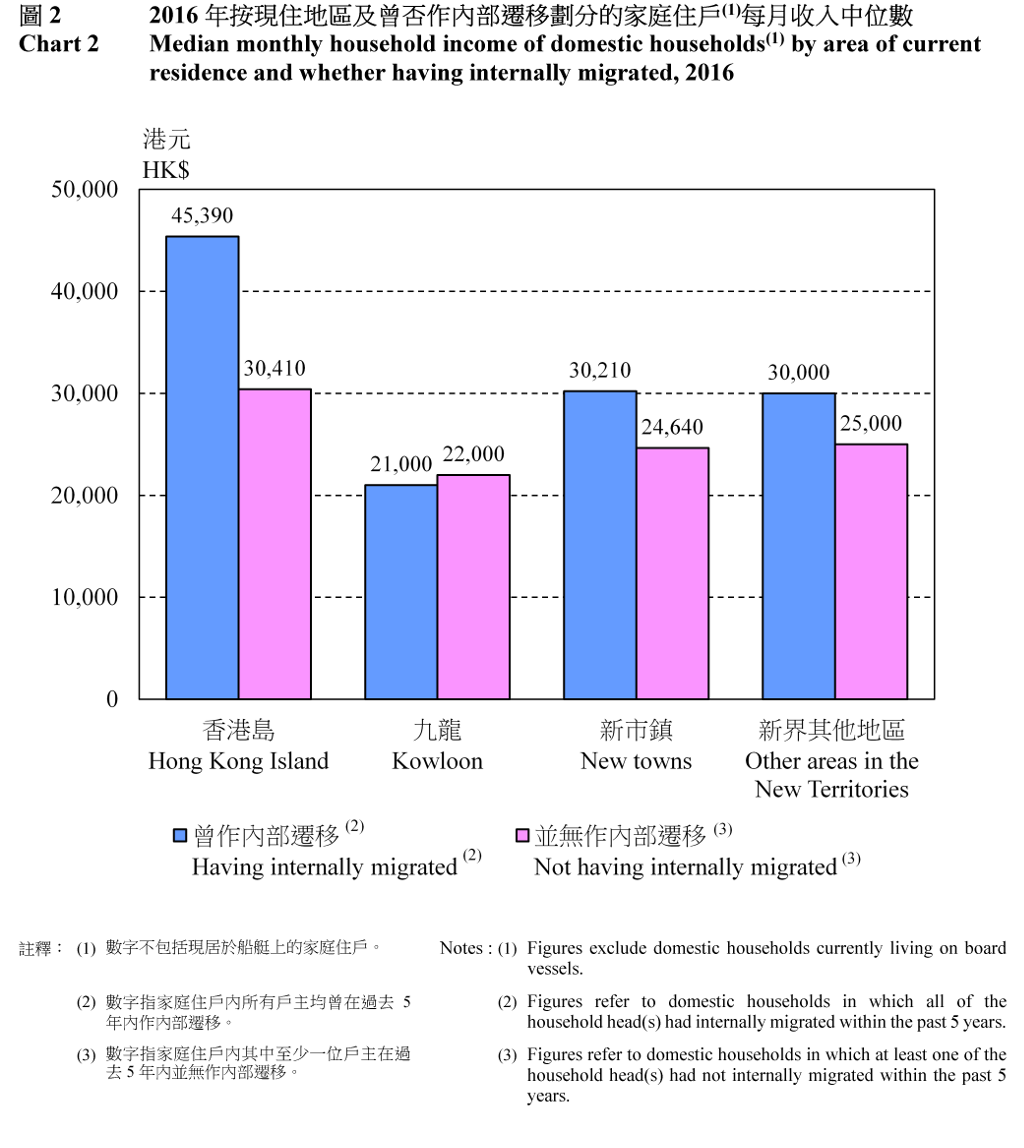
Higher income households were more likely to migrate internally
8. Households which had internally migrated had a higher median monthly household income than those not. This phenomenon was likely related to the greater affordability of higher income households to migrate internally.
9. Among the households which had internally migrated, those which had internally migrated to Hong Kong Island had much higher household income than those which had internally migrated to other areas. The median monthly household income for households that had internally migrated to Hong Kong Island was $45,390, much higher than the $28,500 of all households which had internally migrated. It has nevertheless to be noted that for those households which had not internally migrated, the median monthly household income for those on Hong Kong Island was also higher than households elsewhere.
(Chart 2)
Other references
1. 2016 Population By-census - Main Results
2. 2016 Population By-census - Summary Results

