Home > By-census Results > Snapshot of Hong Kong Population > Economic Characteristics of Hong Kong Population
Economic Characteristics of Hong Kong Population
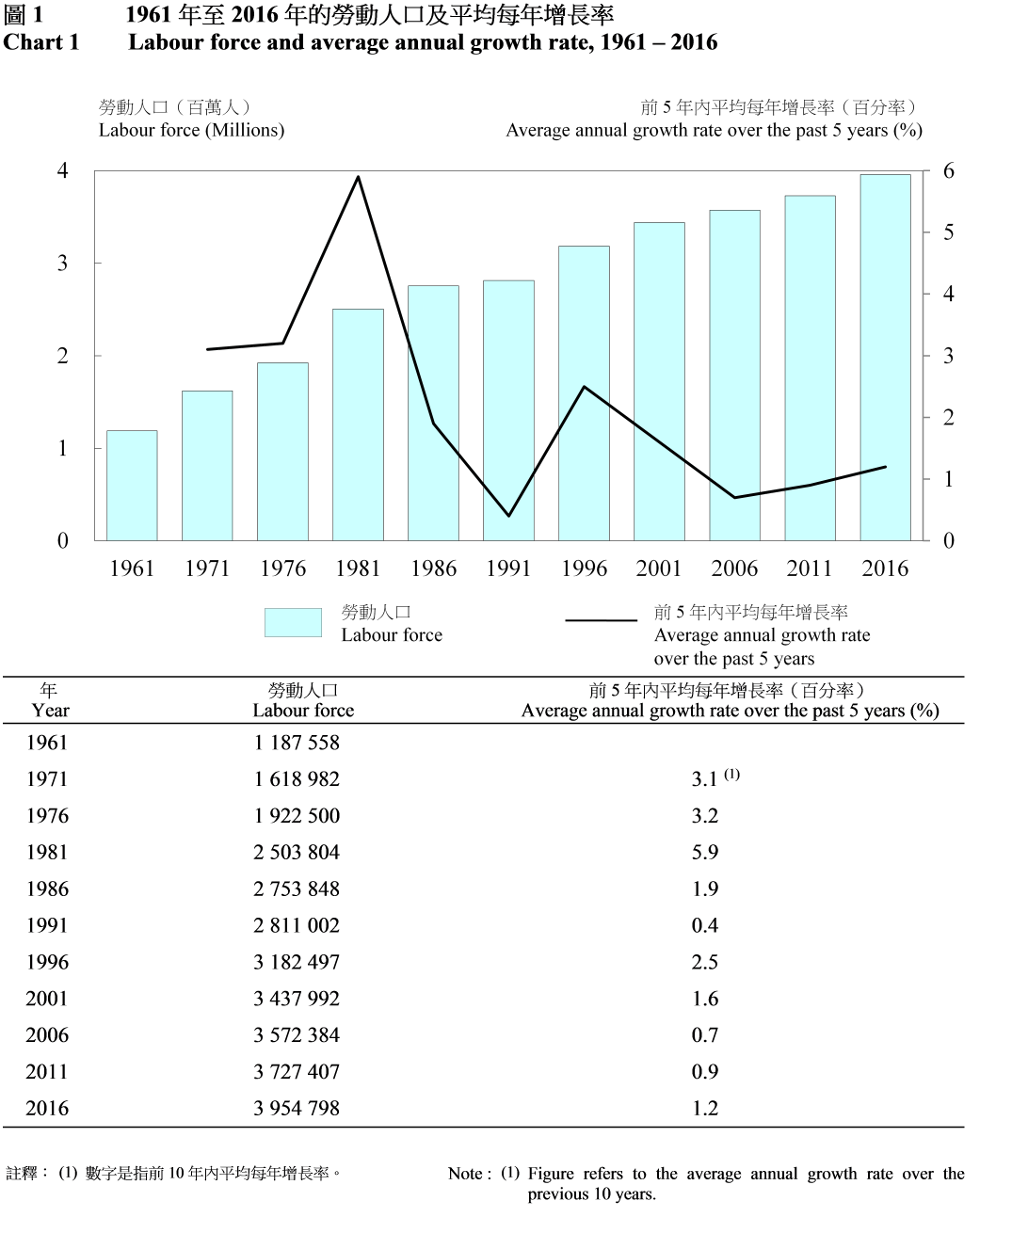
Labour force of Hong Kong increased to 3.95 million in 2016
1. The labour force of Hong Kong increased by 10.7% (or 0.38 million) from 3.57 million in 2006 to 3.95 million in 2016. The average annual growth rate of labour force over the past 10 years was 1.0%, close to that of 0.9% for all persons aged 15 and over.
(Chart 1)
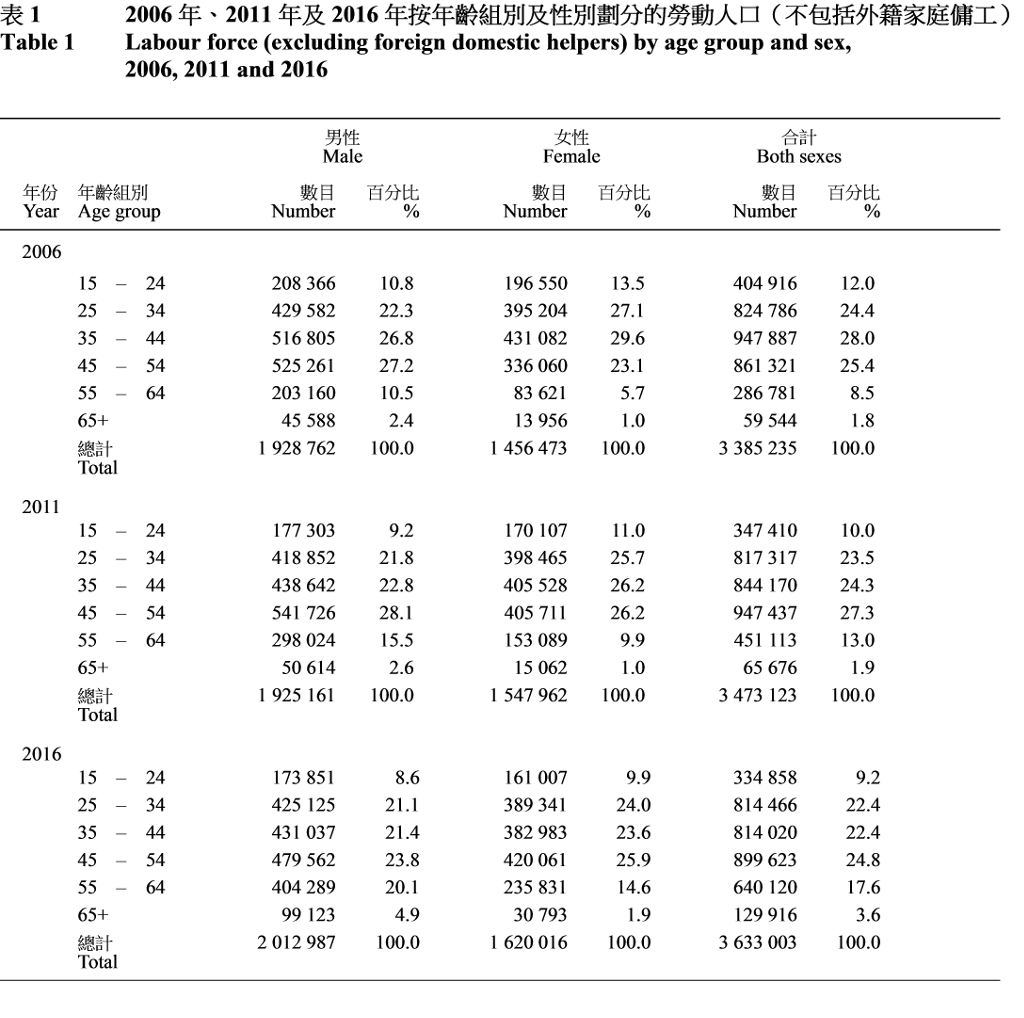
Persons aged 65 and above in the labour force more than doubled
2. Over the past 10 years, persons aged 65 and above in the labour force (excluding foreign domestic helpers) more than doubled, from 59 544 in 2006 to 129 916 in 2016. Due to deferral in entering the labour force amongst the youths as a result of increased post-secondary educational opportunities, persons aged 15-24 in the labour force decreased from 404 916 in 2006 to 334 858 in 2016.
(Table 1)
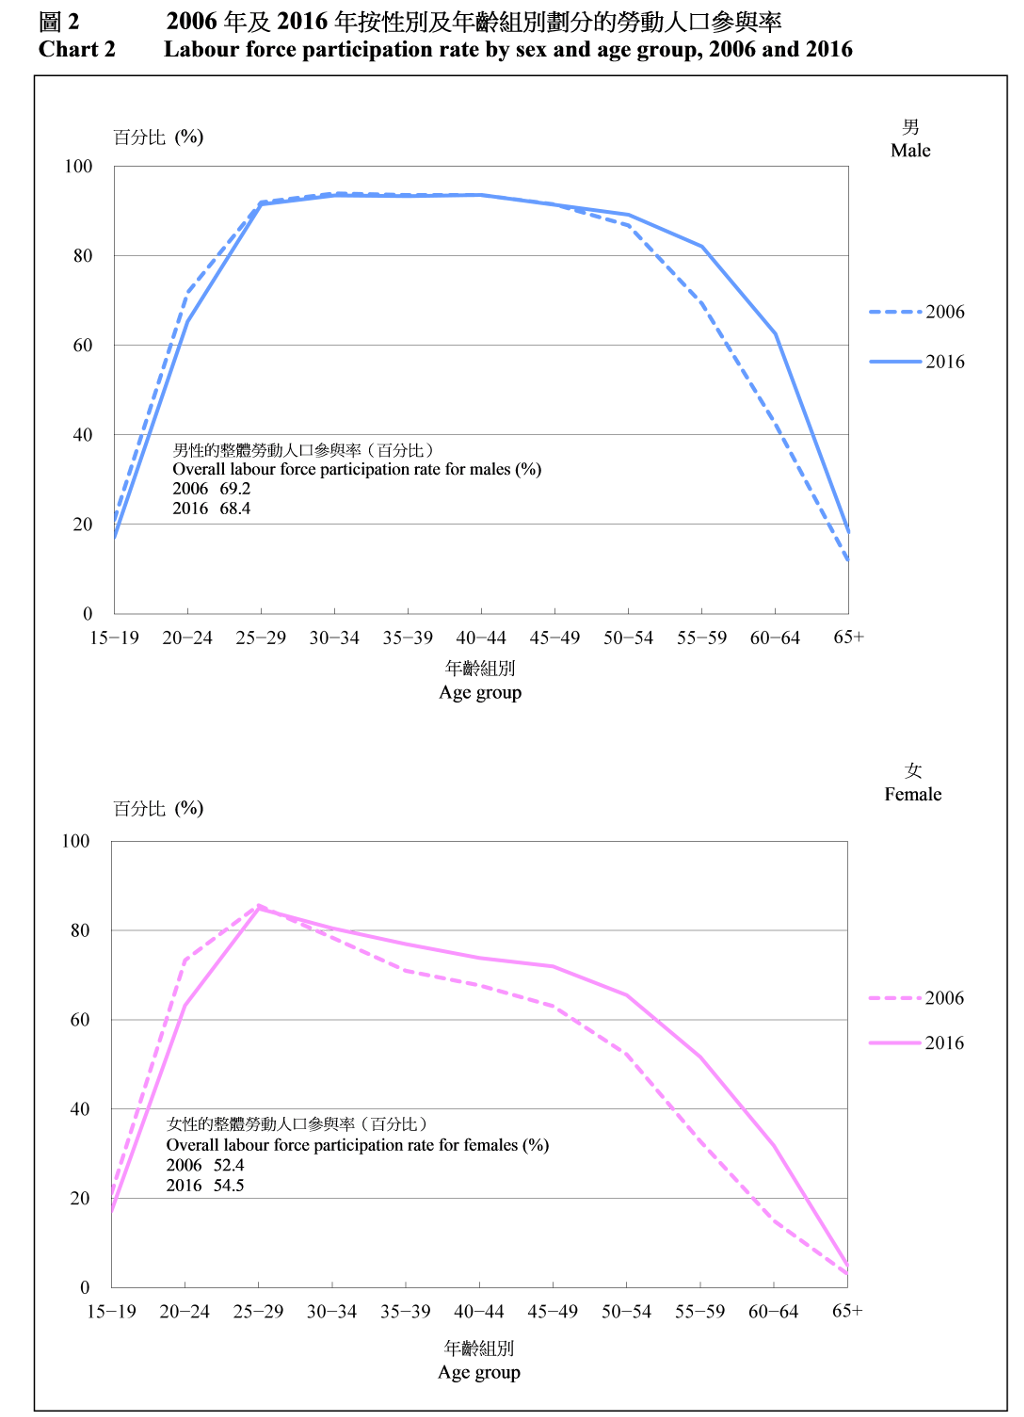
Females’ participation in labour market increased for most age groups
3. Compared with 2006, the female labour force participation rates (refers to the proportion of labour force in the total population aged 15 and over) increased significantly for most of the age groups in 2016. On the other hand, over the same period, the male labour force participation rates increased significantly for those aged 55 and over and remained roughly the same for those of the other age groups.
(Chart 2)
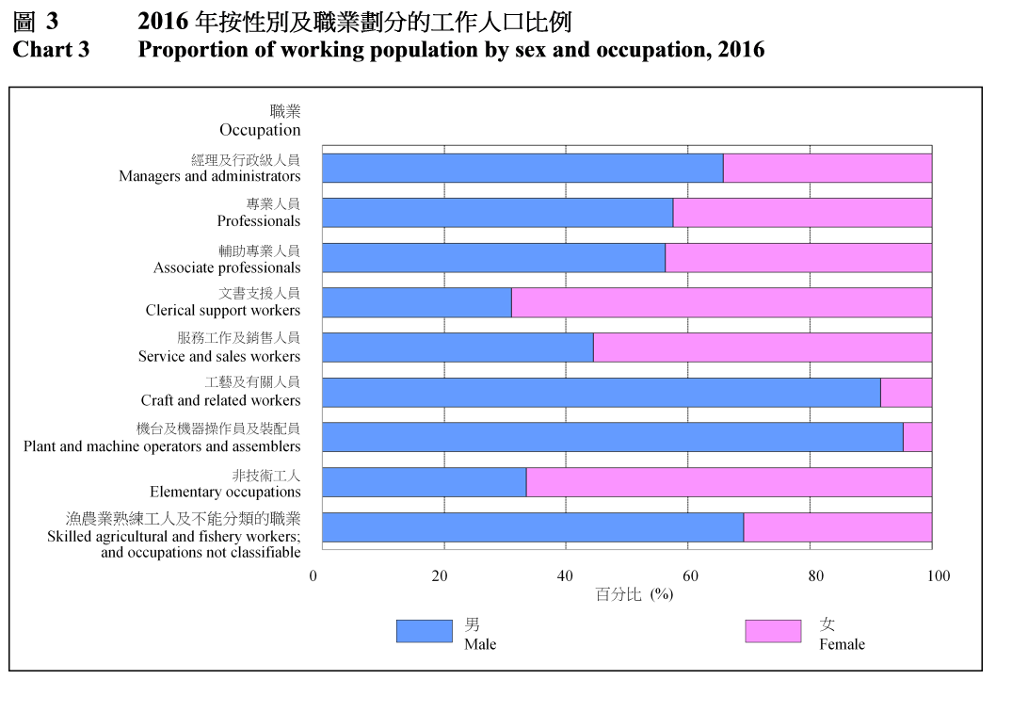
More males than females were engaged in higher-skilled occupations in 2016
4. In the working population, the distribution of males and females among occupations varied. For elementary occupations and clerical support workers, there were proportionally more females than their male counterparts, with the former mainly as foreign domestic helpers. The reverse situation was found in higher-skilled occupations of managers and administrators, professionals and associate professionals. Besides, for craft and related workers as well as plant and machine operators and assemblers, there were significantly more male employed persons than their female counterparts.
(Chart 3)
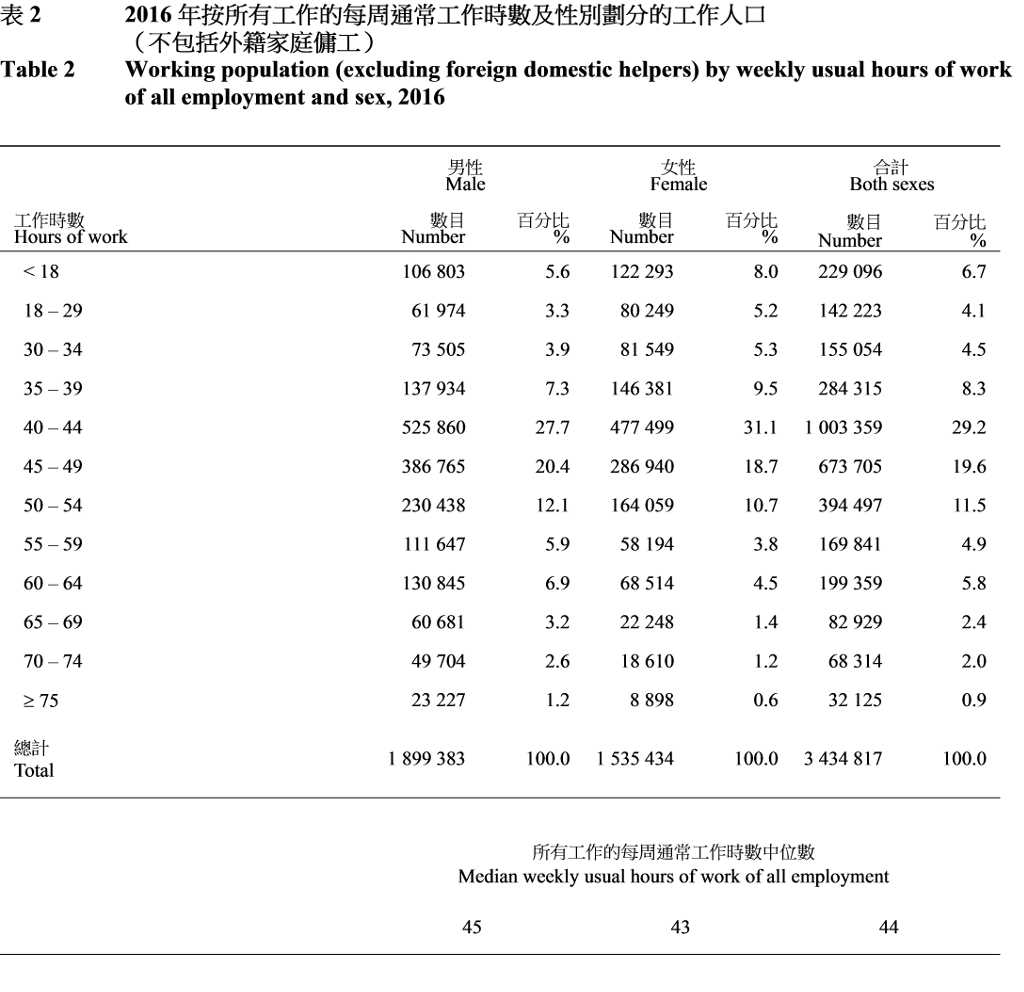
Almost half of the working population usually worked 40-49 hours weekly in 2016
5. In 2016, almost half of the working population (excluding foreign domestic helpers) usually worked for 40-49 hours weekly. The median weekly usual hours of work was 44 hours. The proportion of females who usually worked for 60 hours or more a week was 7.7%, while that of their male counterparts was 13.9%.
(Table 2)
Other references
1. 2016 Population By-census - Main Results
2. 2016 Population By-census - Summary Results

