Home > By-census Results > Snapshot of Hong Kong Population > Housing Characteristics of Hong Kong Population
Housing Characteristics of Hong Kong Population
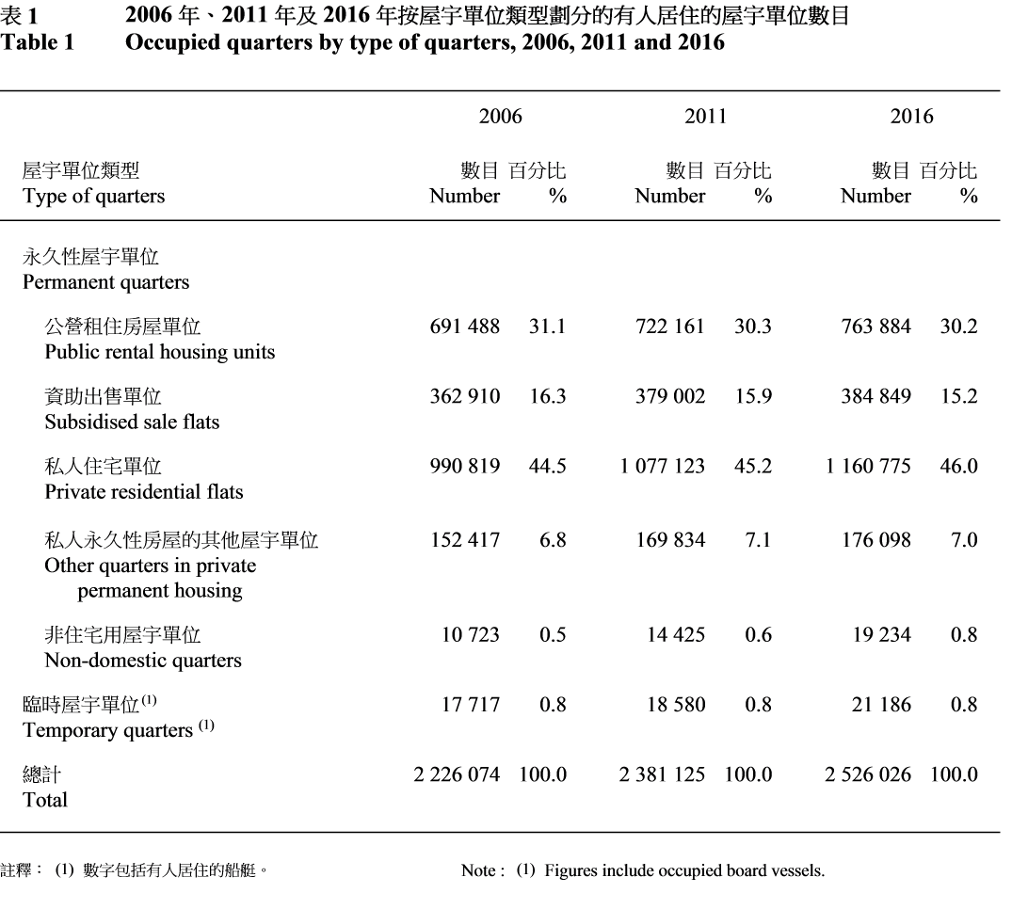
Number of occupied quarters increased by around 0.3 million over the past 10 years
1. In Hong Kong, the total number of occupied quarters increased by around 0.3 million from 2.23 million in 2006 to 2.53 million in 2016. Private residential flats constituted 46.0% of all occupied quarters in 2016, while the share of public rental housing units was 30.2%.
(Table 1)
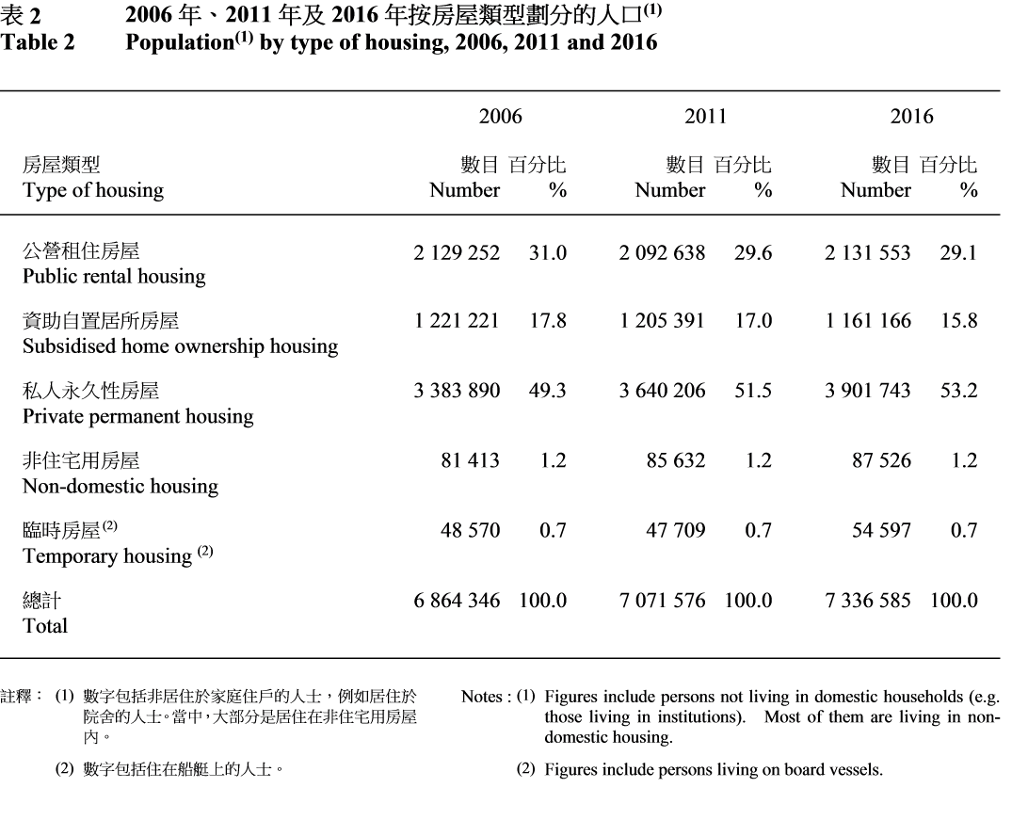
More than half of the population resided in private permanent housing
2. In 2016, 53.2% of the population lived in private permanent housing, which showed an increase of some 4 percentage points over that in 2006. The proportion of the population living in public rental housing and subsidised home ownership housing were 29.1% and 15.8% respectively, each representing a decrease of about 2 percentage points when compared to 10 years ago.
(Table 2)
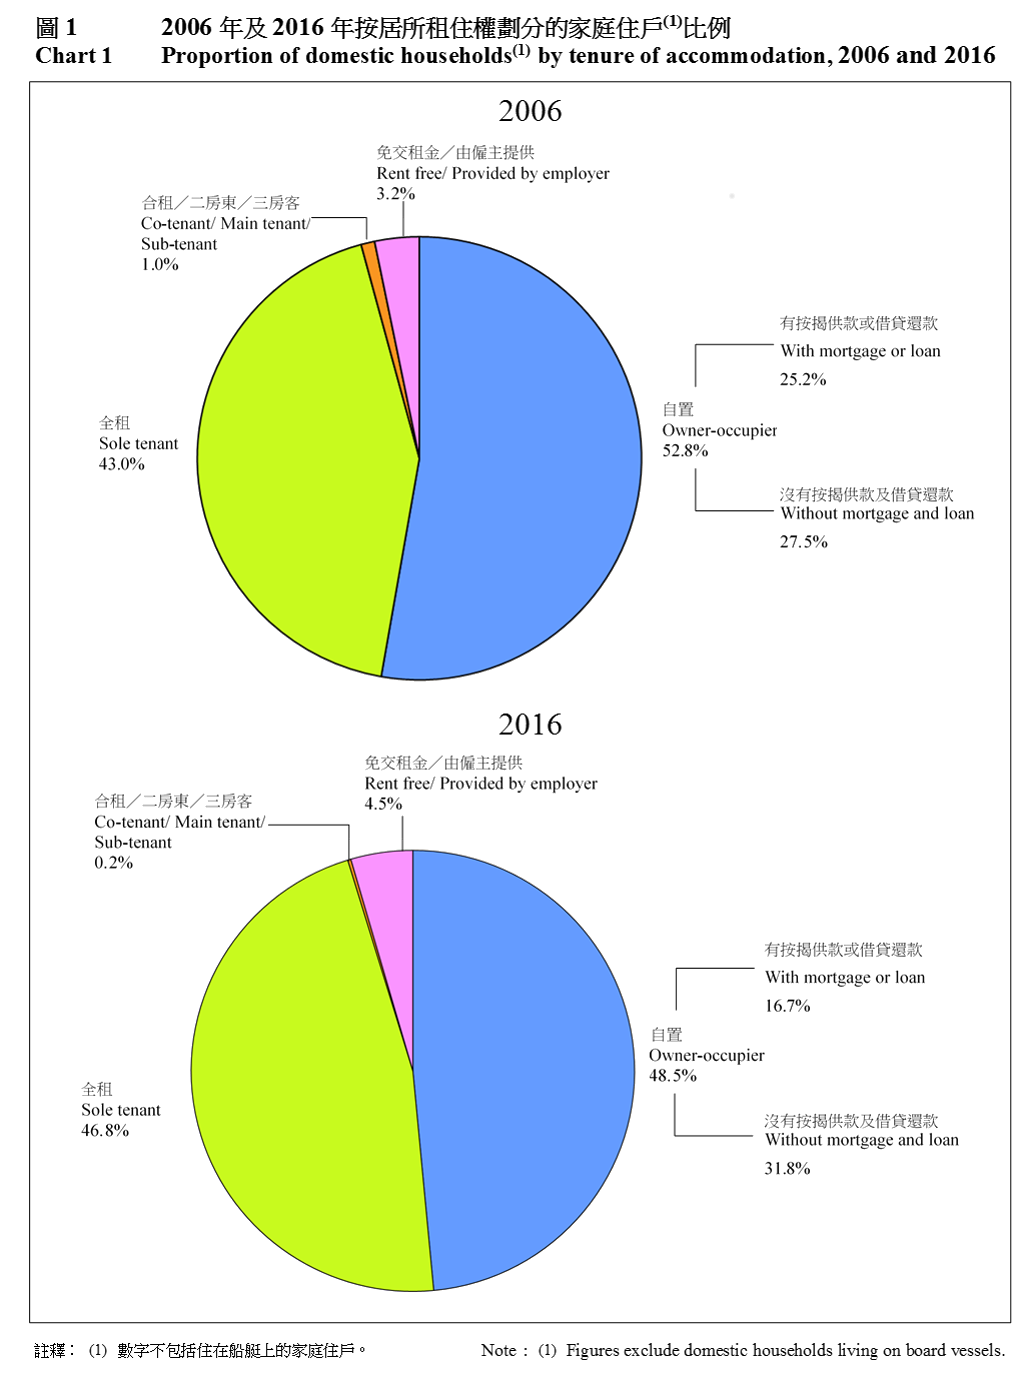
Proportion of domestic households resided in the quarters they owned decreased
3. In the past 10 years, the distribution of the tenure of accommodation of domestic households had changed. 48.5% of domestic households owned the quarters they occupied in 2016, down from 52.8% in 2006. The proportion of sole tenants rose from 43.0% to 46.8% over the same period. Both subletting and co-letting became less common in the last decade, as reflected by a significant reduction in the corresponding proportion from 1.0% in 2006 to 0.2% in 2016.
(Chart 1)
4. Tenure of accommodation was related to the age of the household head. Among households with single household head, those with younger person (aged below 25) as household heads had the lowest proportion of owner-occupiers. This proportion increased from 29.9% to a peak of 50.3% for those aged 50-54, then decreased gradually to 39.5% for those aged 65 and over.
(Table 3)
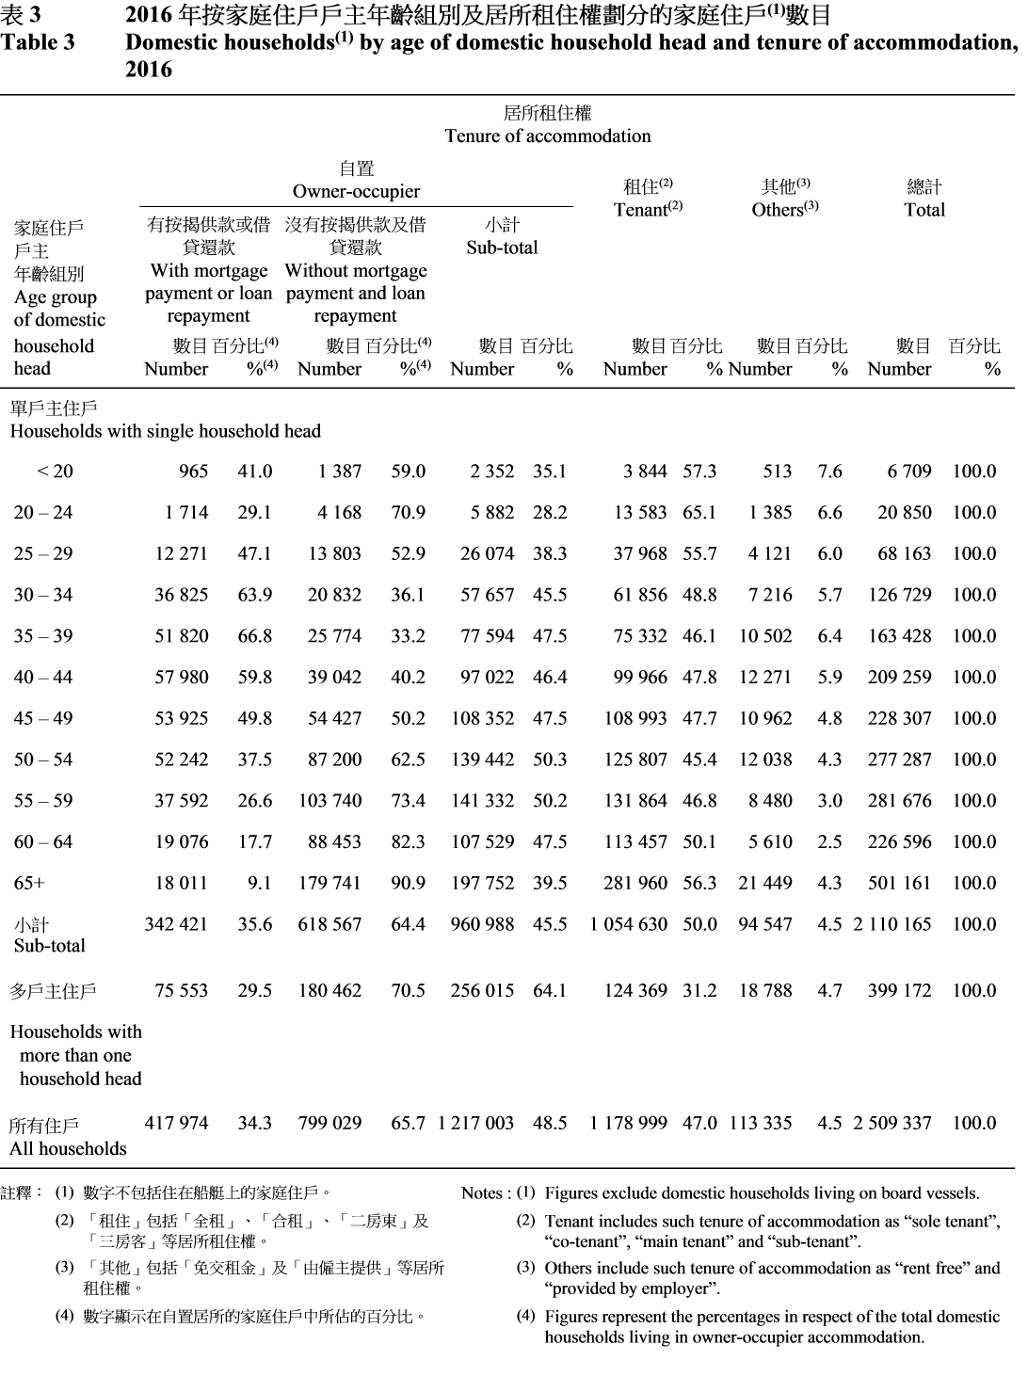
5. In 2016, there were 8 234 households with household heads aged below 25 (as shown in Table 3). In interpreting the figure, it should be noted that a household head might not necessarily be the same as the owner of the quarters that the household was occupying. In population census/ by-census, household head refers to the person acknowledged as such by other member(s) of households. Furthermore, a significant proportion (46%) of these young household heads were in fact residing with their parents in the same households (some with spouse and/ or child(ren) as well).
Owner-occupiers in private permanent housing incurred a median monthly mortgage payment of $10,500 in 2016
6. For domestic households living in owner-occupied private permanent housing and with mortgage payment or loan repayment, the median mortgage payment and loan repayment was $10,500. The median mortgage payment and loan repayment to income ratio was 19.0%.
(Table 4)
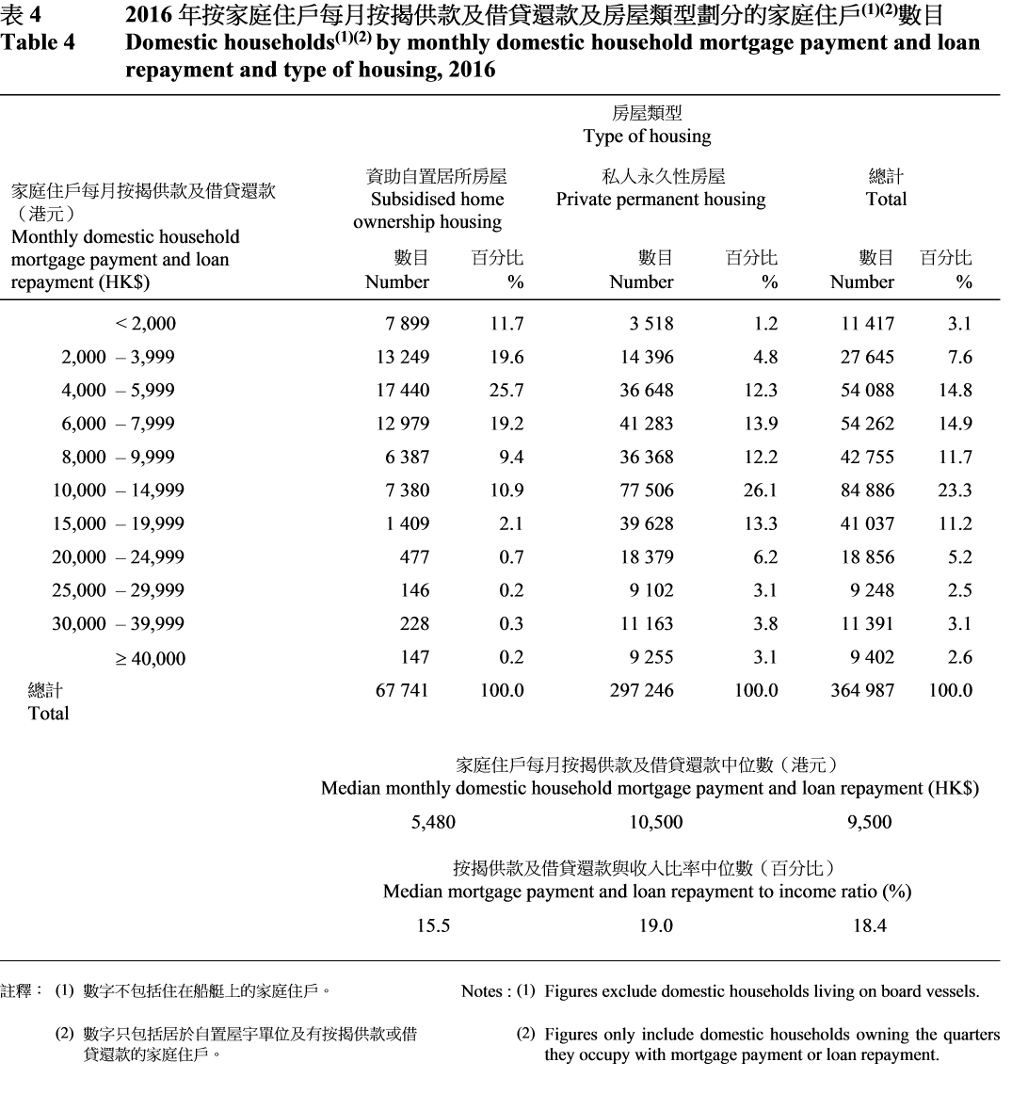
7. In interpreting the figure of 19.0%, it should be noted that the figure refers to “median” ratio of among all owner-occupied households in private permanent housing with mortgage payment and loan repayment. In other words, half of these households had repayment to income ratio more than that percentage, and the other half had less than that.
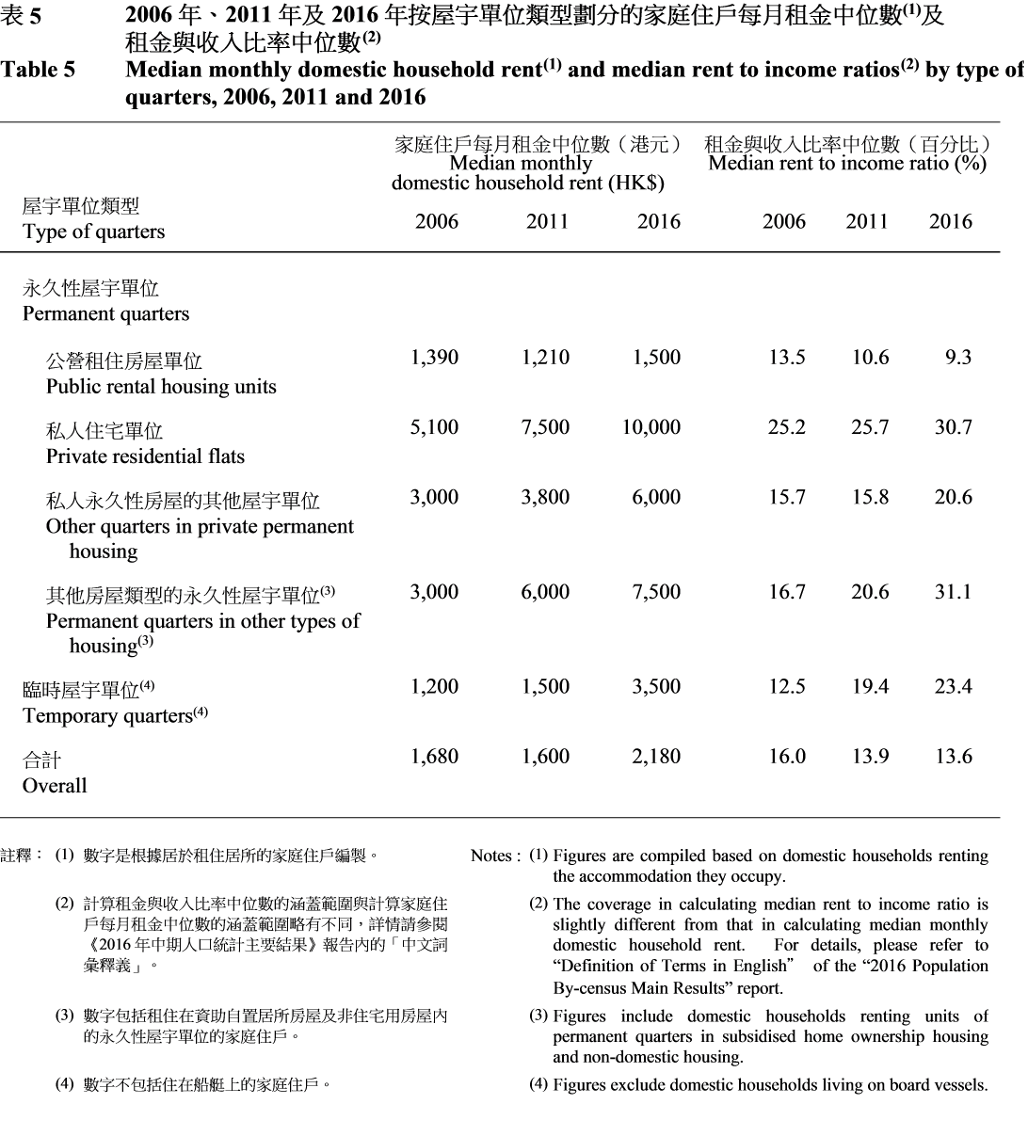
Rental households in private permanent housing recorded a median monthly rent of $10,000
8. In 2016, the median monthly domestic household rent of domestic households renting private residential flats was $10,000, almost doubled the level 10 years ago. The median rent to income ratio was 30.7%, higher than the 25% 10 years ago. For domestic households in public rental housing units, the median rent was $1,500 in 2016, while the median rent to income ratio was 9.3%.
(Table 5)
Other references
1. 2016 Population By-census - Main Results
2. 2016 Population By-census - Summary Results

